


Copyright © Gecko Software, Inc., All Rights Reserved | Contact Us | Privacy Policy | Risk Disclosure
TradeMiner Review
Gecko Software, Inc.
271 N. Spring Creek Pkwy. Ste. A
Providence, UT. 84332 USA
Phone:800-862-7193
Email:gecko@geckosoftware.com
Website:www.TradeMinerPro.com
Product:TradeMiner Pro, Software for finding seasonal
cycles, trends, and patterns in Stocks, Futures, & Forex.
Requirements: Windows, Mac OS, or Linux
200 MB free hard disk space, 1024x768 screen
resolution (minimum) Larger recommended.
RAM 2GB (more is better). Requires Internet
connectivity for installation, but not to run the
application itself, CPU: 2.4 GHz or higher.
-------------------------------------------------------------
by Kent Kofoed
-------------------------------------------------------------
The TradeMiner Pro software is available for Stocks &
Futures markets. The main premise of TradeMiner Pro
is that markets tend to move in cycles and trends.
Because these markets trends tend to repeat
themselves over time, knowing how to recognize these
trends will help any trader make more informed trading
decisions. Even though this review focuses solely on
TradeMiner Pro for stocks, TradeMiner Pro Futures
platform is very similar, so many of the features
mentioned here are included in those packages as well.
What does TradeMiner Pro do exactly?
TradeMiner Pro allows traders to dig through years of
historical stock price data, of all of the stocks that are
listed in the S&P 500, the Dow 30, the Nasdaq 100, as
well as hundreds more stocks & ETF’s. The software
will sort though this data to help tell you what to trade
and when to trade it, with the characteristics of the
trade being specified by you. By allowing you to easily
analyze the historical price data of these actively traded
stocks you will be able to quickly uncover cycles and
trends that meet your search criteria. The design of the
software makes it easy to get
started and, after a short time,
the easy-to-use format allows
you to navigate the software
quickly and easily. Even though
the software does have a pretty
basic design, making it easy for
anyone to use, it has everything
that is needed to quickly sort
through large amounts of data and uncover investment
opportunities.
In addition to being very intuitive, the software is also
very user friendly. The data that you input is in
paragraph format, making it easy to key in your desired
search criteria. For example, a typical search would look
something like this (with the data in bold being the
criteria)… "Prospect for trades in the Month of:
December. Find trades that win at least 90% of the
time, showing Buy. List trades that last at least 10
trading day(s), but no more than 30 trading days. Mine
at least 20 years of history. Dig Now!" You can "dig"
through the data according to which month you are
looking to find opportunities, what length of trading
period those opportunities should be, and what type of
order you are looking, as well as the probability of that
trade being a winning trade. In addition to looking for
any stock within a certain month, you can also mine a
specific stock to find out when the best time to trade
that stock is, historically.
There are three basic steps to the mining process that
can be found in the "Search" tab, “Neural Network” tab,
and "Portfolio" tab. The "Search" tab is where you input
your criteria, as shown in the previous example, and
where you get your results. The results are ranked from
0-5 (5 being the greatest), based on the risk vs reward.
You are able to sort the results by the type of position
you are looking to take (i.e., buy or sell), the stock
symbol of the trade, the enter/exit dates of the trade,
and many other important trade characteristics. At the
bottom of each tab you are given a visual chart based
on the trade you have selected, which can be changed
by clicking the three charts found on the right side of
the screen to help give you a better visual
understanding of the past behavior of the trade. These
three charts include an equity curve showing the
historical return characteristics of the trade, a
histogram with year-over-year profit and loss data, and
a pie chart that shows the average risk and average
reward of the trade.
Once you have moved your chosen trades to
the”Neural Network” tab by double clicking, or by
selecting the “Add” box in the first column, you will be
given yet another opportunity to increase the
probability of a successful trade. This tab utilizes the
“Neural Network” feature of TradeMiner Pro, which
calculates the probability of each of the historical stock
trends in your portfolio occurring in the current year.
After you have analyzed your trades through the
TradeMiner Pro’s Neural Network, each of the trades
selected will be rated from Very High-to Very Low in
probability. I absolutely love this feature, because it
saves me hours of my time, and help me find the
perfect trades that fit my trading strategy.
In the “Portfolio” tab there is another feature that
helps traders further organize their portfolio. This
Filter Portfolio query is designed to help investors limit
the number of trades overlapping. The “Portfolio” tab
also allows you to keep future trades that you are
interested in on hand, by saving them in your “Pick
List”. This allows you to maintain a focused stock
portfolio to meet the demands of the closest trades,
while not losing out on valuable stock trade data that
you have compiled. I absolutely love both the Neural
Network and the Filter Portfolio features, because it
saves hours of my time, and help me find the perfect
trades that fit my trading strategy.
The next tab, “Trade Alerts” of
TradeMiner Pro is a new addition
to the software that adds
convenience, and simplicity to my
trading. This feature gives you
the opportunity to schedule email
alerts that will remind you of your
upcoming trades. Simply check
the “Alert” box, found in the
column to the left of the “Begin
(Open)” date of the “Neural
Network”, or “Portfolio” tabs to
transfer your trade to the “Trade
Alerts” tab. This tab gives the
option of scheduling your alerts
to notify you of your upcoming
trading opportunity 1-10 days in
advance for each of your stocks,
making you sure you never miss
the your perfect trade.
Step four of your TradeMining process consists of
accounting. TradeMiner makes it easy for you to keep
track of your stock portfolio results as a whole by
listing all of the trades that you have taken, and
calculating total profits/losses for each year/month.
This data, as with all other data, can be displayed in a
variety of visual charts on the right side of the screen.
This tab was very useful in helping me track my own
trading trends, and helped me map out next year’s
future trading strategy.
There are also two more important tabs that I should
quickly mention. If you click on the "Settings" tab you
can select the universe of stocks that you want the
TradeMiner Pro to search through. Your selection could
simply be all active stocks in each index, or only one of
the individual indexes. It is all up to you.
The final tab in TradeMiner Pro is the “Education” tab.
When you click on this tab your browser will open and
you will have access to education material from the
TradeMiner Pro website. Since education is one of the
most important aspects of successful investing, this is
definitely a very valuable
feature of the software, and it
is included in each of the
TradeMiner Pro packages.
TradeMiner Pro for stocks,
specifically, has multiple
educational videos to help you
get started, TradeMiner Pro
manual, frequently asked
question, Current Market
Analysis posted weekly for
Trading Club members, and
access to a free 14-day of the
Track ‘N Trade Trading
Platform trial. What a deal!
In summary, TradeMiner Pro is
a excellent tool for any trader
who is looking to gain an
investing edge through
analyzing historical stock
trends and cycles. Even
though the TradeMiner Pro
software is based on complex
mathematical formulas that
allow the software to quickly
mine, sort, and organize large
amounts of historical data, the
simple interface makes using the software user
friendly, so that anyone can quickly learn how to use
the software effectively to find the trades that they’ve
been looking for.
By giving each user the ability identify the market
trends and cycles that tend to repeat themselves over
time, the TradeMiner Pro software is definitely a must-
have for any trader, from beginning traders to
seasoned professionals, who is looking for a statistical
edge in the markets.
by: Kent Kofoed Mr. Kofoed is a market technician and
research analyst for Gecko Software, Inc.

Call: 1-800-862-7193 Ext. 2

Discover Historical Trends
And Market Cycles
Ph: 1-800-862-7193 Ext. 2
*For your convenience data and alerts will automatically renew yearly at the end of the current term - cancel anytime. Trading financial instruments, including Stocks,
Futures, Forex or Options on margin, carries a high level of risk and is not suitable for all investors. The high degree of leverage can work against you as well as for you.
Before deciding to invest in any of these financial instruments you should carefully consider your investment objectives, level of experience, and risk appetite. Only risk
capital should be used for trading and only those with sufficient risk capital should consider trading. The possibility exists that you could sustain losses exceeding your
initial investment. You should be aware of all the risks associated with trading and seek advice from an independent financial advisor if you have any doubts. Past
performance, whether actual or hypothetical, is not necessarily indicative of future results. All depictions of trades whether by video or image are for illustrative purposes
only and not a recommendation to buy or sell any particular financial instrument. Due to trade commissions variability they have not been factored into any trade
examples. The impact on market prices due to seasonal or market cycles may already be reflected in market prices.
See full risk disclosure.
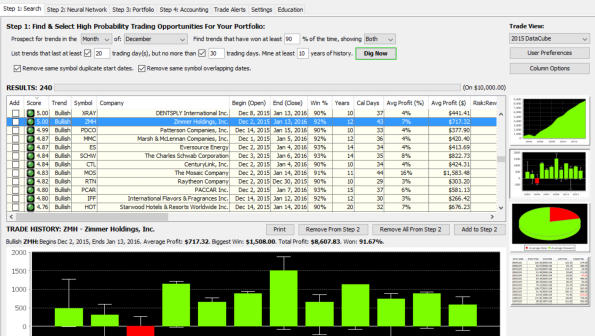
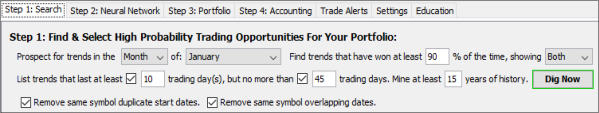
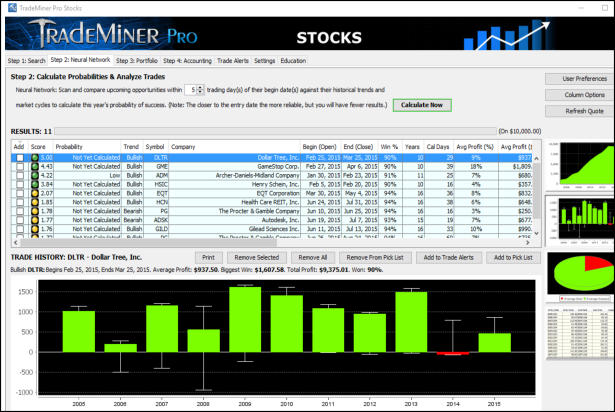
Figure A-1: A close-up screenshot of the allowable criteria that can be specified in TradeMiner.


